


With the latest update to Axiom, we’ve included some powerful new screens that let you review your rules-mapping information in a clear and concise way.
In this tutorial, we’ll explain how to use the new matrix screens to view rules-mapping summaries, relationships, and attestation results all in one place.
What are the Axiom matrix mapping views for?
The matrix views on Axiom present your data in a table format. They are a useful way to see all of your information and quickly search it to find what you’re looking for. They don’t present information in a structured tree like the visual mapping editor, but they do allow you to browse and navigate a large amount of information all together and get some additional facts about your data.
You can also use the matrix views to get customised relationship mapping and attestation summaries – the following sections contain further details about how and when to do this.
Use the matrix views when you want to:
-
Quickly find information without knowing where it’s mapped
-
Compare different items
-
Filter to find all items which match particular criteria
-
Spot gaps in your information
-
Prepare an extract of your mapping information to present outside of Axiom
How do I use the matrix mapping screens?
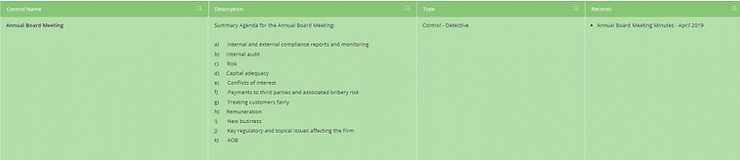
To get started, click on the ‘Rules-Mapping’ main menu item and then select “Risks”, “Controls”, or “Processes” from the sub-menu to find the matrix for the type of item you’re looking for.

Each screen will show a table which lists items of the type you have selected (Risks, Controls, or Processes) as rows. Each column contains some information about the item on that row.
You can use the ‘search’ or other filter controls at the top of each column to control what data is shown. You will find that this varies according to the type of data in that column; for example, dates will give you options to search for values before, on, or after a given date. Columns with text in will allow you to apply a search filter.
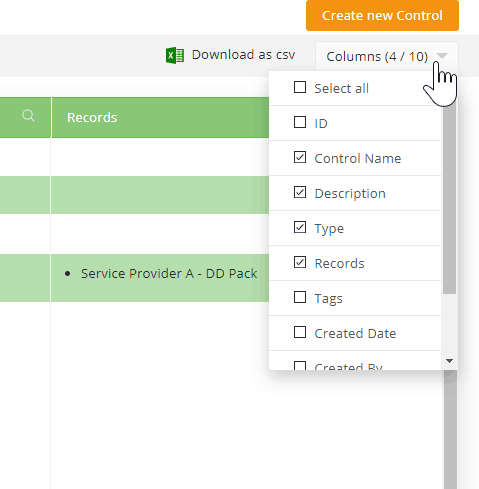
You can pick which columns are displayed using the “Columns” control over on the top-right of the screen. You’ll notice the ability to turn on some columns that are disabled by default (such as the Axiom ID) in here so this should be your first destination if you’re looking for some additional information.
Showing attestation data
The matrix views can be used to provide summaries of attestation data about the items that you’re looking at.
To get started, tick the ‘Show attestation data’ box at the top-left of the screen. You will be able to provide a date range here – the attestation information that the screen will display will take into consideration only attestations due within this time period.
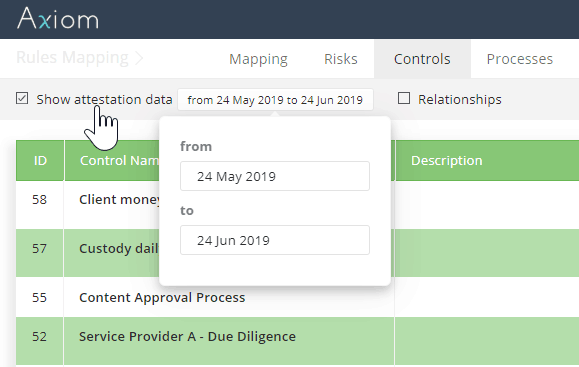
Remember that the due date of the attestation is important here! If an attestation was due on the 23rd May but attested (late) on the 24th May, then it would not be included within the scope of the data returned in the screenshot above. Equally if an attestation was due on the 24th June and attested (late) on the 25th June, it would be included within the data. The criteria for whether an attestation is counted or not is only that it was due in the period you pick – no matter when it was attested.
Once you’ve picked a date range (or simply allowed the default of 30 days’ worth of data) then some additional columns will appear on the table, giving you an overview of attestation results for that item within the period.
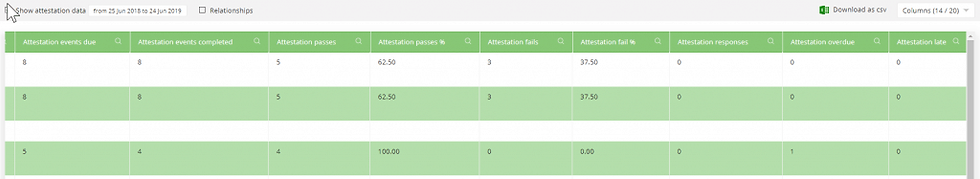
The columns contain counts of various attestation facts and are explained in detail below:
Reminders: A list of Axiom reminders that contain this item Attestation events due: How many times this item was due to be attested within the period Attestation events completed: How many times the due attestations were actually completed Attestation passes: How many times the item was marked with a ‘Pass’ attestation result Attestation passes %: The proportion of passed attestations within the total, as a percentage Attestation fails: How many times the item was marked with a ‘Fail’ attestation result Attestation fail %: The proportion of failed attestations within the total, as a percentage Attestation responses: How many times the item prompted the user for a data set response (To be used with our upcoming improved attestation data feature!) Attestation overdue: How many of the due attestations are still (as of today’s date!) overdue i.e. not done Attestation late: How many of the due attestations were attested late (i.e. after their allotted due date)
This means that you will always find the following to be true:
Attestations passed + Attestations failed + Attestations with data responses + Attestations overdue = Attestation events due
However, the measure of ‘late’ attestations is a separate value (none, some or all of the attestations due in the period could have been late).
Showing relationship data
The matrix screens allow you to identify mapping relationships between items in a flexible way. To get started, tick the ‘Relationships’ box at the top-left of the screen:
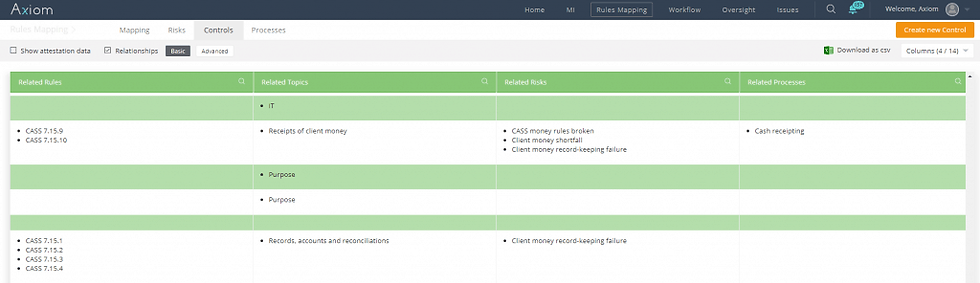
The relationships viewer has two modes: Basic and Advanced.
When using Basic relationships, you’ll notice some new columns added to the matrix, which will include four of the following five: Related Rules, Related Topics, Related Risks, Related Controls, and Related Processes. The missing one will correspond to the item matrix you are viewing – for example, the Controls matrix will show related Rules, Topics, Risks, and Processes.
Basic mode simply provides a the names of each related item under the appropriate heading. For example, ‘Related Risks’ shows a list of Risks related to the item on that row.
When using Advanced relationships, however, you will have more detailed control over how the matrix is built.
When you click ‘Advanced,’ you’ll notice a new relationship builder section appears which looks like this:
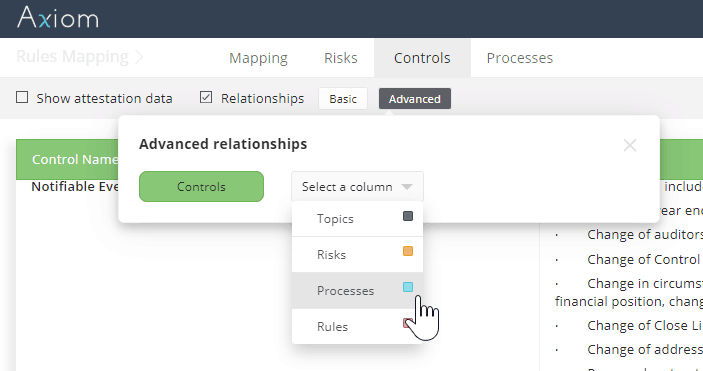
The first item on the left of the relationship builder will reflect the matrix screen that you are on. On the Controls matrix, the leftmost item is always ‘Controls.’
Use the “select a column” dropdown menu to pick another item type, however, and the matrix can be extended:
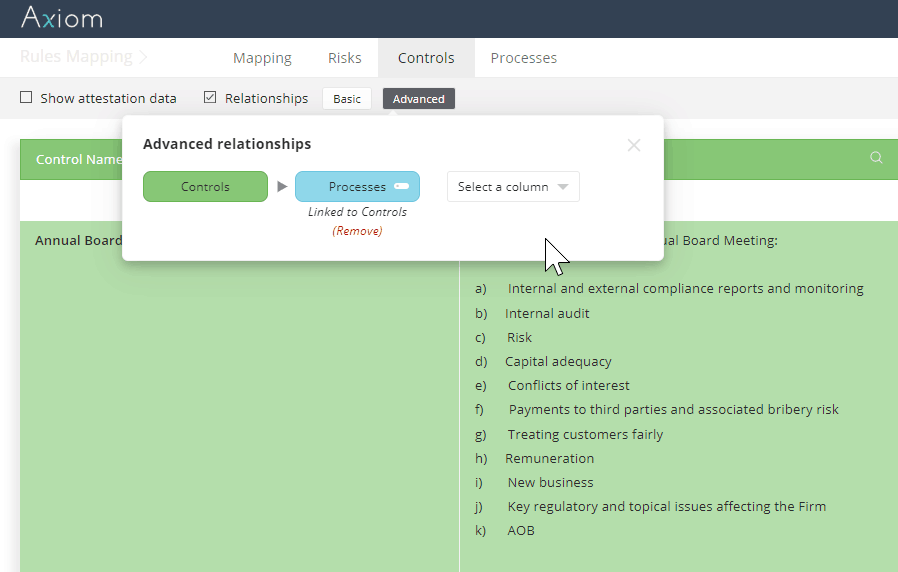
Here we’ve added Processes to the matrix. This will show Processes which are directly linked to the Controls already in place.
It’s possible to add further items, as well:
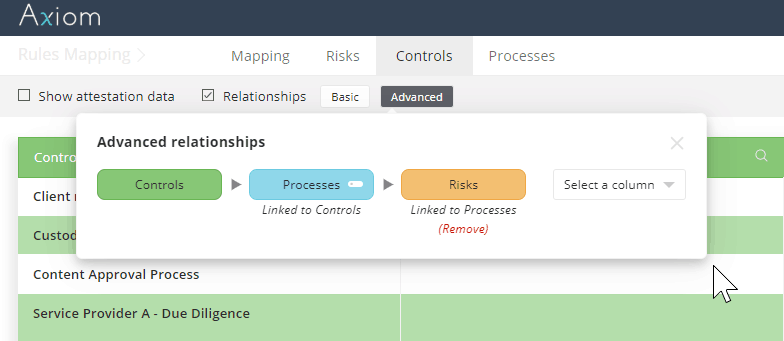
Here we’ve added Risks to the Matrix. This will show Risks which are directly linked to the Processes in the sequence. It’s important to remember that the relevant links are only to the previous item in the relationship sequence – in this example, the Risk doesn’t have to be linked to the Process and the Control on the row – only the Process.
This feature allows you to create a detailed matrix view that corresponds to your way of thinking about the compliance journey. For example, if your firm thinks about Controls first, and then you want to know what risk each control mitigates and which rule each risk is centred around; that’s possible to design using the Axiom advanced relationships builder.
Finally, advanced relationships allow you to specify how each row is split in the table. You have two options, toggled using the white icon on the right of each item tile.
This shows that Processes have been added, and rows are ‘compact.’
This shows that Processes have been added, and rows are ‘expanded.’
The difference between these two modes is simple:
Compact shows the names of all related items together in one cell, just like the basic view:

Whereas expanded shows each item broken out into its own duplicate row:

You’ll notice that when rows are expanded, a further column showing the item’s name is automatically included.
Can I combine both attestation and advanced relationship data?
Yes you can, although it’s important to remember that the attestation data shown is purely about the primary item on that row. Continuing the example above, attestation data added would reflect the control appearing on each row, not any other item added as part of the relationship builder.
Further questions?
We hope that you’ve found this article useful and gives you the necessary information required to start using the new matrix screens, but if we’ve left anything out or you have any additional questions, please don’t hesitate to get in touch with us at support@axiomhq.com!